 |
||||||||
|
||||||||||||||||||||||||||||||||||||
|---|---|---|---|---|---|---|---|---|---|---|---|---|---|---|---|---|---|---|---|---|---|---|---|---|---|---|---|---|---|---|---|---|---|---|---|---|
|
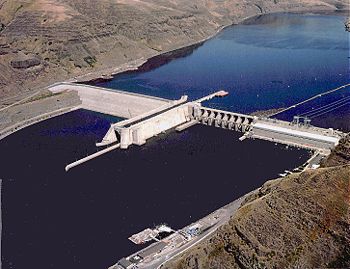 |
Lower
Granite Project Plant size - 810 MW |
In February 1995, the ASFM was used to measure the turbine discharge in one bay of the project under three conditions: without fish diversion screens, with standard and with extended fish screens in place. A 4% efficiency reduction was indicated for both screen types at low discharge and for standard screens at high discharge, and a 6% reduction for extended screens at high discharge. To test whether long-term flow data could be obtained with a greatly reduced number of acoustic paths, five paths ASFM Monitor was installed in the lower region of Bay A conduit, downstream of the full ASFM. With the Extended Submerged Bar Screens installed, the Monitor recorded discharges within ±1.5 % of the reference full ASFM. With no screens installed, however, the difference was as high as 5 %, indicating greater variability of velocity profile without the screens forcing the flow into the lower region. The experiment indicates that a ASFM Monitor can achieve satisfactory results, provided the full height of the intake is sampled. The ASFM measurements were also used to recalibrate the Winter-Kennedy taps. These results are encouraging, as they indicate that reliable flow monitoring can be achieved with the ASFM Monitor cost-effectively not only in relative terms but, after calibration, also in absolute terms. Publication: presented at IGHEM 2006, Hydro2009, IGHEM 2010, HydroVision 2012
|
 |
In 1998 and 1999, ASFM measurements were compared with Winter-Kennedy index tests, showing consistent results. The results also indicated that the installation of the fish screens in the intake resulted in a 2-3% reduction in turbine efficiency. The ASFM measurements were also used to recalibrate the Winter-Kennedy taps. Publication: presented at WaterPower 1999
|
|
 |
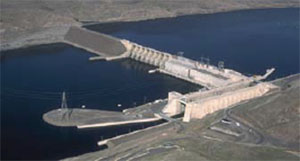
Bonneville
Project Plant size - 1093 MW |
Use of the ASFM at Bonneville in 1998, 1999 and 2000 greatly improved the definition and estimation of the effects of fish diversion devices on Kaplan turbine performance. The effect on turbine efficiency of a prototype surface collector, with and without fish diversion screens in place has been assessed. The results also provided baseline information on the performance of existing turbines for comparison with the performance of new minimum gap runner units that were being installed. The ASFM gave the Corps accurate, reliable data to determine that up to a 5% loss in efficiency resulted from having the screens in place. The ASFM measurements were also used to recalibrate the Winter-Kennedy taps. Publication: presented at IGHEM 2006, HydroVision 2000 |
 |
The
Dalles Project Plant size - 1820 MW |
The Portland District of the US Army Corps of Engineering is engaged in a rehabilitation program at The Dalles Dam on the Columbia River. Turbine efficiency testing is being performed before and after the planned turbine upgrades. As part of the testing program, an initial set of flow measurements using the ASFM were made at Unit 9 in November 2000. A second set was made after the rehabilitation of the unit in the summer of 2001. The ASFM measurements were also used to recalibrate the Winter-Kennedy taps. Publication: presented at IGHEM 2006
|
 |
Little Goose Project Plant size - 810 MW |
In January 2003, two sets of index tests were conducted on Unit 3: one without fish screens and one with Extended Length Submerged Bar Screens. In February 2003, two index tests were also conducted on Unit 4: one without fish screens and one with Extended Length Submerged Bar Screens. The purpose of these tests was to establish unit performance with and without the screens for use in developing updated cam information to optimize unit operation. A 3-bay, 20 paths/bay ASFM was used for all the measurements. The ASFM measurements were also used to recalibrate the Winter-Kennedy taps. Based on the tests, the client concluded that performance improvements obtainable from the revised cam approach 1.5 % near peak efficiency with fish screens installed. Publication: presented at IGHEM 2006
|
 |
Lower Monumental Project Plant size - 810 MW |
In January 2002, two separate index tests were conducted on Unit 2. In February 2002, two separate index tests were also conducted on Unit 6. The purpose of the testing was to establish unit performance both without and with Standard Length Traveling Screens for use in developing updated cam information to optimize unit operation. A 3-bay, 20 paths/bay ASFM was used for all the measurements. The ASFM measurements were also used to recalibrate the Winter-Kennedy taps. The client estimates that up to 2.5 % efficiency improvements are obtainable from the resulting revised operation with fish screens installed. Publication: presented at IGHEM 2006
|
 |
John Day Project Plant size - 2160 MW |
In November 2001, two series of index tests were conducted on Unit 9. The purpose of the tests was to establish unit performance both without and with Standard Length Traveling Screens for use in developing updated cam information to optimize unit operation. A 3-bay, 20 paths/bay ASFM was used for all the measurement. The ASFM measurements were also used to recalibrate the Winter-Kennedy taps. The client estimates that up to 2.0 % efficiency improvements are obtainable from the resulting revised operation with fish screens installed.
|
 |
Chief Joseph Project Plant size - 2160 MW |
In October 2008, as part of the Federal Columbia River Power System Power Plant Efficiency Improvement Program, a blind comparative test was conducted on unit 15 to determine the suitability of the ASFM to calibrate Winter Kennedy taps in Francis turbines. A comparative test of near real time flow measurement for time of flight, relative flow (Winter Kennedy) and our ASFM was conducted by the client. Our experience indicated that the measurement of the discharge in an intake with a large vertical pier in the center of the intake just upstream of the measurement plane could affect measurement accuracy. For this reason, with the client’s permission, the ASFM was equipped with 10 vertical paths in addition to the 20 horizontal paths. The vertical paths were used to compute a correction factor that was applied to the discharge calculated from the horizontal paths. Further successful comparative testing between the acoustic time-of-flight flowmeter and the ASFM was performed in 2011. |
